Every business and marketer wants to have the superpower of being able to draw insightful conclusions from the massive sea of data that exists today. Luckily, we have an arsenal of advanced tools at our disposal; among them, data visualization tools stand out as the superheroes of information analysis. In this article, we’ll explore the captivating world of data visualization and explore how it can reveal the hidden treasures within social media analytics.
Table of contents
- What Are Data Visualization Tools?
- Why Does Data Visualization Matter?
- Some Characteristics of Data Visualization Tools
- From Bar Charts to Pie Charts: Painting a Picture with Data
- Data Visualization Tools
- What to Consider When Selecting a Tool
- Social Media Analytics
- Data Visualization and Social Media Analytics
- Influencer Identification
- How to Make the Most of Your Data?
- Fueling Success with Data
What Are Data Visualization Tools?
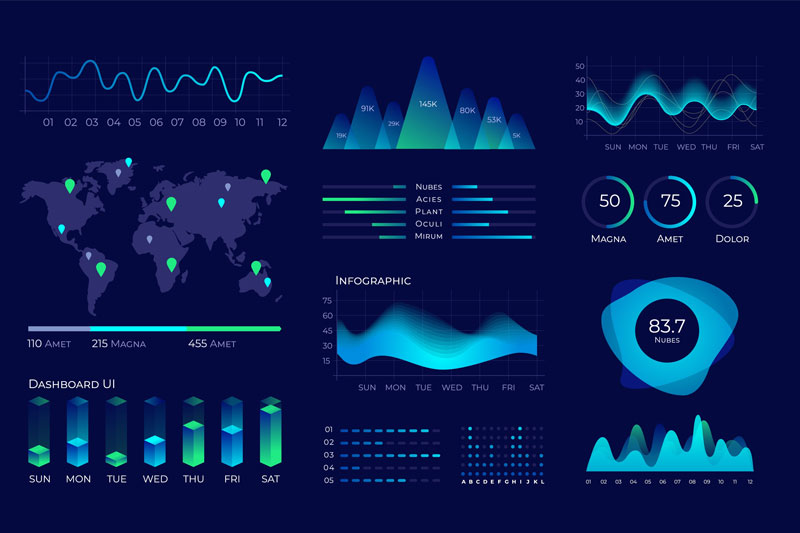
In this tech-savvy era, information is power, and data visualization tools are the wands that wield it! You have a bunch of data at your disposal, but it’s just sitting there, unexplored, in rows and columns of numbers and text. Data visualization tools are like enchanted mirrors that reflect this data into stunning, colorful visuals – charts, graphs, maps, and more! They transform the mundane into the extraordinary and provide difficult-to-understand information in a visually appealing way.
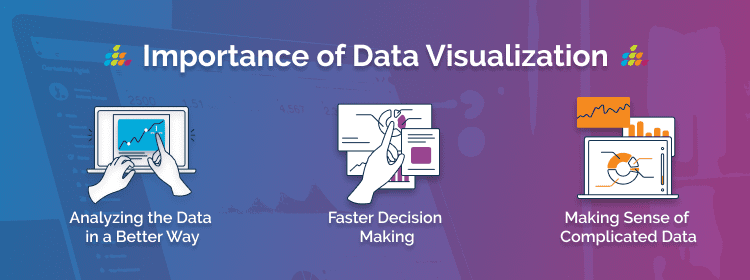
Why Does Data Visualization Matter?
It’s not just about the eye-catching visuals; data visualization is all about insight. Consider yourself reviewing your social media activity. With a quick glance at a beautiful line graph, you spot a spike in engagement last week. You’ve just uncovered a crucial pattern that can shape your marketing strategy. Insights like these can be the key to unlocking success in the competitive world of social media.
To swiftly identify data trends, businesses require data visualization tools, which is otherwise difficult. Thanks to the visual representation of data sets, analysts can see concepts and new patterns. The quintillion bytes of data generated every day are difficult to understand without data proliferation, including data visualization.
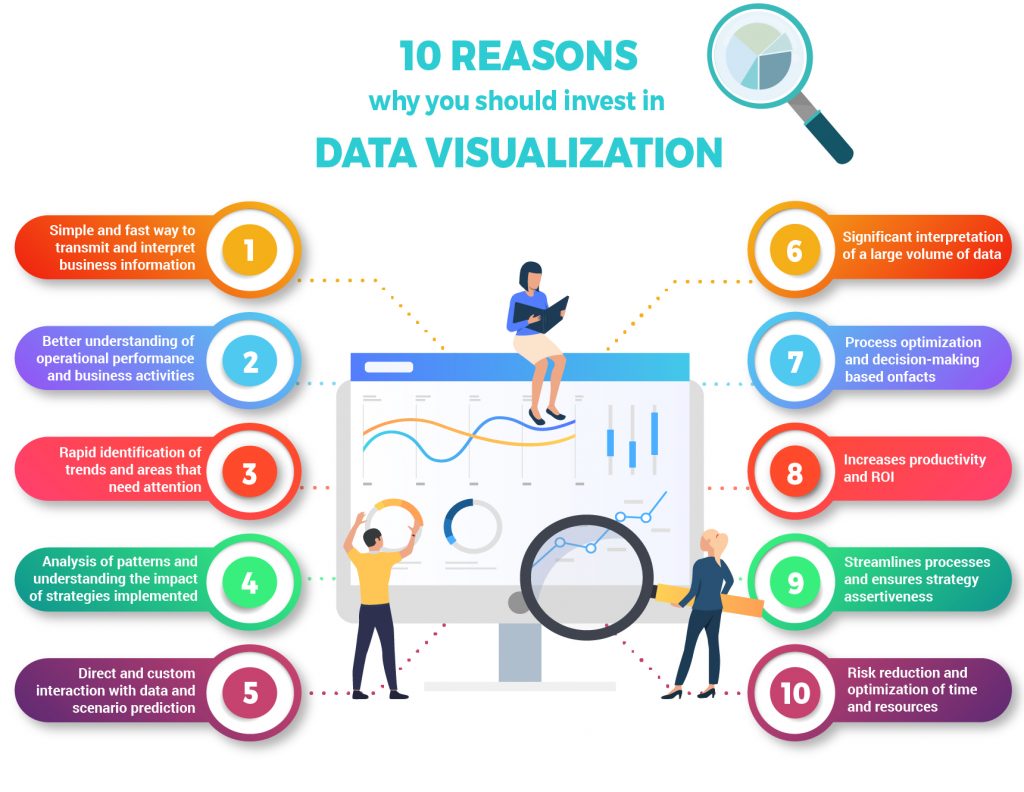
Every professional industry may benefit from understanding its data; hence data visualization is becoming more prevalent across all industries that use data. The most valuable resource for every firm is information. By using visualization, you may use this information and communicate your ideas more persuasively.
Some Characteristics of Data Visualization Tools
Despite the fact that each data visualization tool is unique, most tools have a few similar (and quite useful) capabilities. These aspects will be briefly discussed in this part, along with the reasons they are crucial when choosing your ideal tool.
API for Data Importing
A lot of programs have an API that enables you to import data from your data-gathering tool into your visualization tool. Without an API, the process of visualizing the data would be slowed down by having to download, upload, and manually format the data.
Chart Templates
You can create a visually pleasing representation quickly by using chart templates, which are predefined layouts. These are ideal because you can just enter your data into the chart without the need for graphic design or data analysis.
Animated Charts
You may highlight important numbers, trends, or factors by interacting with interactive charts, which means you don’t need to create unique representations for every analytic.
Version History
By seeing and restoring previous iterations of your data visualizations, you are able to correct mistakes without losing any of your data.
Mobile Enhancement
As the name implies, mobile optimization enables you to modify how your visualizations appear on mobile devices.
From Bar Charts to Pie Charts: Painting a Picture with Data
Boring spreadsheets are not the norm anymore. Data visualization tools can turn tedious numbers into vivid bar charts, pie charts, and line graphs. These visual representations are like the artists of the data world, telling stories that leap off the screen and captivate your audience. Who knew data could be so artistic?
Data Visualization Tools
When it comes to data visualization, there are some fantastic tools available that can transform your raw data into captivating visual representations. Let’s explore a few of these tools that can turn your data into a work of art:
Tableau
With just a few clicks, Tableau enables you to quickly build breathtaking interactive dashboards and infographics. You may easily study your data from multiple angles and find hidden patterns thanks to its drag-and-drop feature.
Pros:
- Uses access controls and end-to-end encryption
- Narrative dashboards
- Support for connectivity with multiple data sources and integration with Slack
Cons:
- Greater cost in comparison to alternative tools
- Incline learning curve
Power BI
Power BI, the superhero of data visualization, empowers you to create dynamic visualizations and reports. It seamlessly integrates with various data sources. It allows you to bring your data to life with vibrant visuals and interactive elements.
Pros:
- Superior Security
- No memory or speed restrictions
- Compatible with Microsoft Products
Cons:
- Personalized and rich dashboard
- Excessive CPU use
- Macs and the desktop version are incompatible
D3.js
If you’re a coding wizard looking to create custom data visualizations, D3.js is your helping spellbook. This JavaScript library provides a wide range of tools and functions to create highly customizable and interactive visualizations that can be embedded into web pages.
Pros:
- Gives non-programmers access to tools for data visualization
- Attention to web standards
- Flexible & cutting-edge library
Cons:
- Huge entry DOM manipulation takes a long time
Zoho Reports
The integrated business intelligence and online reporting features of Zoho Reports, also known as Zoho Analytics, make it simple to create and distribute comprehensive reports in just a few minutes. The enhanced visualization tool also makes it easier to import Big Data from popular databases and tools.
Pros:
- Simple report creation and editing
- Report sharing and email scheduling
Cons:
- User education should be improved
- Large amounts of data cause the dashboard to get muddled
Infogram
For data visualization, Infogram is similar to a painter’s palette. You can choose from a wide range of pre-made templates and charts and modify them to meet your needs. From simple bar graphs to complex infographics, Infogram allows you to create visually stunning representations of your data.
Pros:
- TLS-grade security advantages
- Group cooperation
- Rich library of images
Cons:
- Restrictions on custom designs.
- Less built-in sources compared to comparable tools
Plotly
Plotly is the Picasso of data visualization tools. It offers various chart types and visualizations, allowing you to create captivating plots, graphs, and maps. With its interactive features and real-time collaboration capabilities, Plotly is a favorite among data enthusiasts.
Pros:
- Exporting high-quality images
- The interface is really engaging
Cons:
- Speed is a concern
- The free version has a number of restrictions
- Various screen flashings cause confusion and distraction
What to Consider When Selecting a Tool
Although we discussed 6 alternative tools for data visualization in the preceding section, everyone’s optimal tool will be unique. Therefore, how can you pick the best one for you?
Check these things before choosing a data visualization solution for your company:
How Well Does It Fit Your Needs?
You must determine whether the product specifically matches your demands because every organization uses different types of data. To begin, ponder the following:
- Does the tool support the kind of data we need to visualize?
- Does it work with our customer relationship management (CRM) program or data gathering software?
- Does it match our skill set, i.e., is it user-friendly for novice data analysts?
- Will it function on our hardware and website?
Pricing
When purchasing new software, price is a crucial consideration. Consider these questions before you click “sign up”:
- Can we afford to buy this tool?
- Is the tool worth it to us?
- Does a less expensive tool exist that can deliver the same value?
Future-Compatibility
Will the tool still be useful to you in a year even though it may currently fulfill your business needs? If you sign up for a product that doesn’t scale with your organization, you risk locking yourself into a contract you’ll regret because many solutions use subscription-based pricing.
As you evaluate your tool’s future compatibility, consider the following:
- Can the tool handle more data volume?
- Can we monitor the results of our key performance indicators (KPIs) using the tool?
- In a year, will we still be using the tool?
- Can it evaluate every internet marketing tactic we use?
Now, before delving into social media analytics, let’s first understand the term.
Social Media Analytics
Social media has become a vast collection of valuable riches, with billions of users sharing their thoughts, opinions, and preferences on various platforms. It empowers businesses to tap into this enormous ecosystem, extracting valuable insights to understand customer behavior, track trends, monitor brand reputation, and drive marketing strategies.
Data Visualization and Social Media Analytics
Social media analytics and data visualization tools operate together like two peas in a pod. Social media analytics work as the detective, gathering clues and investigating audience behavior, campaign success, and the impact of your social media efforts. And here come the data visualization tools, the talented artists who transform those clues into captivating visuals that speak volumes.
Do They Go Hand-in-Hand?
Social media analytics is all about digging deep into the ocean of data generated by platforms like Facebook, Twitter, and Instagram. It’s about uncovering the trends, understanding what makes your audience tick, and making informed decisions based on solid insights. But let’s face it, staring at endless spreadsheets and numbers can make your eyes glaze over. That’s when the superpowers of data visualization tools come into play!
These tools turn raw data into eye-catching graphs and interactive maps. They transform those overwhelming rows and columns into visual stories that speak directly to your brain. Suddenly, you can spot patterns, trends, and outliers with a single glance. It’s a secret language that only you and your data can understand.
However, it goes beyond just producing aesthetic images. Data visualization tools bring clarity and understanding to your social media analytics. They help you communicate your findings to others in a visually appealing way that’s easy to grasp. It captivates your audience and makes them say, “Wow, I get it now!”
These tools also give you the power to explore your data in real time, slicing and dicing it to uncover hidden gems. Do you want to know what times of the day have the highest levels of engagement? No issue! With a few clicks, you can create an interactive chart that lets you zoom in and out, filter, and drill down into the nitty-gritty details.
So, data visualization tools and social media analytics go together like peanut butter and jelly. They bring the numbers to life, making data analysis exciting, insightful, and, dare I say, fun! So, let’s find the power of these dynamic duos and how they work their magic in unraveling the mysteries of your social media world.
Influencer Identification
The term “social media analytics” refers to a broad range of metrics and data that provide light on the effectiveness and results of your social media campaigns. Here are some examples of social media analytics:
Follower Growth
This measure keeps track of the increase in followers on your social media pages over time. It aids in measuring the development and ubiquity of your brand.
Engagement Rate
The involvement of your audience with your social media material, including likes, comments, shares, and clicks, is measured by the engagement rate. It shows how well your followers respond to your material.
Reach and Impressions
Reach is the number of unique users who view your social media material, whereas impressions are the overall frequency with which it is displayed. You can better understand the exposure and visibility of your postings using these data.
Click-Through Rate (CTR)
The percentage of people that click on a link or call-to-action is measured by the CTR of your social media posts. It demonstrates how well your content is generating traffic to your landing page or website.
Conversion Rate
The conversion rate measures the number of users who carry out a desired activity, such as making a purchase, subscribing to a newsletter, or completing a form. It assists in assessing how well your social media marketing has been at generating conversions.
Sentiment Analysis
Sentiment analysis involves analyzing the tone and sentiment of user comments, mentions, or reviews about your brand on social media. It helps gauge your brand’s overall sentiment and perception among your audience.
Social Media Mentions
This indicator keeps track of how frequently your brand or particular keywords connected to it are discussed on social media sites. It assists in keeping track of brand mentions and user-generated material pertaining to your enterprise.
Audience Demographics
Social media analytics can give you information about the age, gender, geography, and interests of your audience. You can better adapt your content and campaigns to engage with your target audience by understanding the demographics of your audience.
Social Media Analytic Tools
Numerous social media analytics tools are available in the market, each with its own features and benefits. Following are some popular social media analytics tools:
Hootsuite
The popular social media management application Hootsuite has powerful analytics features. It allows you to plan and produce content, interact with the audience, and track performance. The analytics tool in Hootsuite offers insightful data on important parameters, including audience engagement, reach, and impressions. Businesses can track their success on social media and make data-driven decisions thanks to the configurable reports and real-time monitoring it provides.
Pros: It supports multiple social media platforms and allows the scheduling and publishing of content.
Cons: The advanced features and reports are available only in higher-priced plans. For new users, the user interface can be overwhelming.
Sprout Social
A complete social media analytics and management tool is Sprout Social. Deep insights into audience behavior, campaign effectiveness, and social media trends are provided. Metrics, including follower growth, engagement rate, sentiment analysis, and industry benchmarks, are part of Sprout Social’s analytics tool. Additionally, it offers tools for customer relationship management (CRM), content scheduling, and team collaboration.
Pros: The user-friendly interface and customizable reports make navigating and extracting insights easy.
Cons: Sprout Social can be expensive for small businesses, and some advanced features may require additional add-ons.
Buffer
Buffer mostly serves as a platform for scheduling posts on social media, but it also has some rudimentary analytics tools. Users can publish content on various social networking networks on a timetable and monitor engagement indicators like likes, comments, and shares. The data from Buffer gives you a broad overview of audience interaction and post-performance patterns. It is a popular option for small enterprises and individuals, despite the fact that it cannot provide as thorough data as other platforms.
Pros: Buffer is renowned for its brevity and usability. It works seamlessly with other social networking sites and applications.
Cons: Buffer’s analytics capabilities are more limited compared to other tools. It might not be appropriate for companies that need in-depth analytics.
Google Analytics
Google Analytics is an effective web analytics tool that can be used to monitor social media traffic and how it affects the functionality of websites. Businesses can assess the success of their social media initiatives, identify the sources of referral traffic, and examine user behavior on their website that originates from social media by setting up social media tracking in Google Analytics. Numerous indicators are available in Google Analytics, including page visits, bounce, conversion, and goal completion rates. These metrics offer important information about the overall effect of social media on website performance.
Pros: It provides detailed insights into website traffic from social media, conversion tracking, and audience behavior analysis.
Cons: Google Analytics requires technical setup and configuration and may not provide real-time social media analytics.
Brandwatch
Brandwatch is a sophisticated social listening and analytics application that aids firms in comprehending and examining internet discussions pertaining to their brand and sector. It offers sentiment analysis, enabling customers to determine whether the general attitude toward their brand is positive, negative, or neutral. Trend analysis, competition benchmarking, and influencer identification are among Brandwatch’s analytics tools. The application makes it simpler to comprehend and present data efficiently by providing customizable dashboards and data visualization options.
Pros: This tool offers powerful data visualization and customization options, enabling in-depth analysis.
Cons: Brandwatch can be costly, making it more suitable for larger enterprises. To use its features, it has a steeper learning curve and which may require more training.
Mention
A social media monitoring tool called Mention helps companies keep track of brand mentions on various online media, such as blogs, news websites, forums, and social media. In order to keep on top of conversations and interact with your audience, it gives real-time alerts whenever your brand is referenced. The analytics components of Mention provide information on competitor analysis, sentiment analysis, and brand reach.
Pros: The application makes it simple for organizations to track and examine social media mentions because of its user-friendly design and connectivity with services like Slack.
Cons: Mention’s analytics features are relatively basic compared to other tools, with limited advanced reporting options.
How to Make the Most of Your Data?
In the end, your data visualization tool is simply that—a tool. No matter what technology you choose, if the authenticity and dependability of your data are poor, so will the quality of your visualizations.
So how do you guarantee the quality of your data? We advise you to:
- Find duplicate records and remove them before you create data visualizations
- To avoid having data in different formats (such as “10/2/2010” and “July 2, 2023”), precisely define your data formats
- Long-term data collection is preferable to short-term data collection because the latter may result in an erroneous representation of your data
- Recognize outliers and take them into consideration to prevent them from affecting your visualizations
- The metrics you use for your data should be expressed explicitly (for example, “We define daily conversion rate as the percentage of leads that become customers from midnight day one to midnight day two”).
- Keep your data in a safe cloud storage system
- Prior to producing your visualizations, locate data gaps and erroneous data and resolve them
- Collect data using top-notch tools
Fueling Success with Data
Businesses looking for a competitive edge could use social media analytics to their advantage. Organizations have access to a variety of effective tools that allow them to monitor campaign performance, gain insightful information about audience behavior, and make data-driven decisions. From the comprehensive analytics of Sprout Social to the user-friendly simplicity of Buffer, and the in-depth monitoring capabilities of Brandwatch and Mention, these tools offer businesses a treasure of data that can unlock the path to success in the ever-evolving world of social media.


